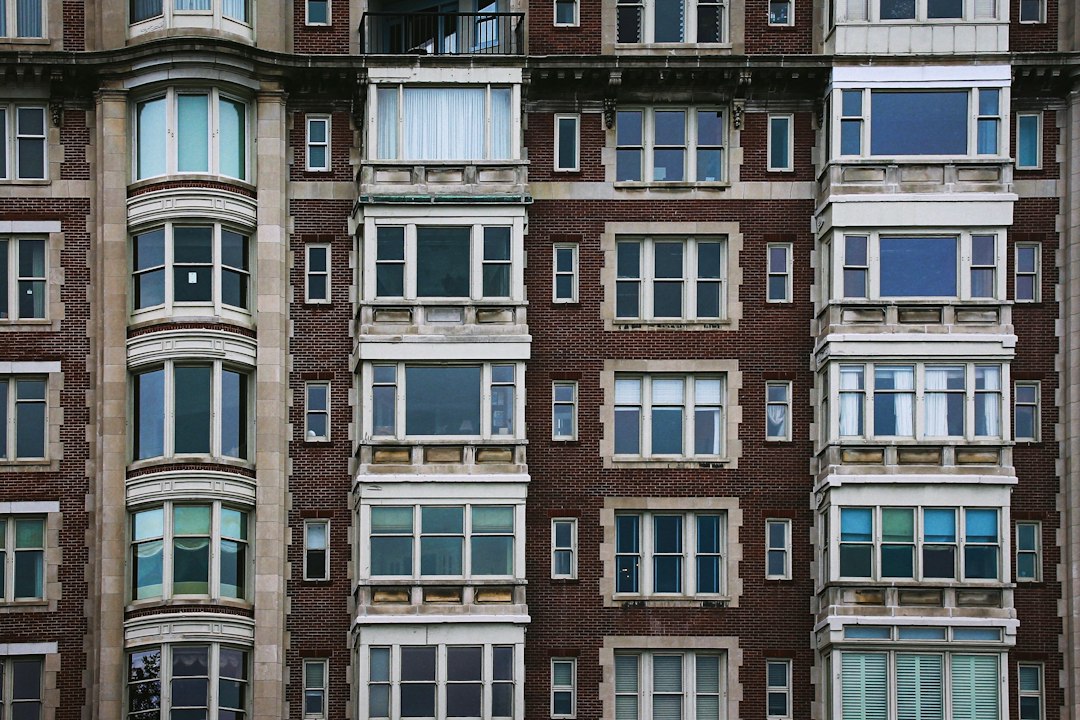
The hardest places to find an open apartment in Chicago right now are along the North Side lakefront (Lincoln Park, Lakeview and Roscoe Village) and in the Bucktown–Logan Square–Avondale stretch, where more than 96% of units were leased in the second quarter of 2026. The most room is in the West Loop and Fulton Market, where the city’s biggest wave of new construction is landing, and on the Southwest Side.
Citywide, apartment vacancy is low; we went through why every report gives a different number. But a city average hides a lot. Here’s how it breaks down by area, using second-quarter 2026 reports from Cushman & Wakefield, Northmarq and Cross Street.
One caveat before the numbers: these firms draw their own submarket lines, which don’t match the city’s 77 community areas or the neighborhood names people actually use. “Lakeview/Lincoln Park/Roscoe Village” is one bucket in one report and three in another.
Lincoln Park, Lakeview and the North Side lakefront: the tightest market
The North Side lakefront is the tightest big apartment market in the city. Cushman & Wakefield puts its Lakeview/Lincoln Park/Roscoe Village submarket at 96.7% occupied across 36,196 units, the highest of any Chicago submarket it tracks, with average effective rent of $2,210, up 6.7% from a year earlier.
Northmarq, which splits the area up differently, has Lincoln Park at 3.1% vacancy, the lowest in the market. It also found the biggest year-over-year improvements next door: Lakeview dropped 80 basis points to 5.0%, and Rogers Park dropped 90 basis points to 5.3%.
Further up the lake, Cushman & Wakefield’s Far North Chicago/Uptown submarket, the largest in the city at 62,069 units, was 96.3% occupied, with average effective rent of $1,504. And Cross Street named Lincoln Square, Wicker Park and Lake View among its tightest neighborhood markets, with Avondale, North Center and Ravenswood fully leased in the quarter.
Part of the reason is that so little is being added. Cushman & Wakefield counts 241 units under construction in the whole Lakeview/Lincoln Park/Roscoe Village submarket. If you’re hunting there, browsing apartment buildings in Lincoln Park by name, from 1920s courtyard buildings to newer towers like Lincoln Common and Foundry, is a decent way to get a feel for what exists before units open up.
Logan Square, Avondale and the Northwest Side: nearly full
The Bucktown/Logan Square/Avondale submarket is nearly as tight as the lakefront: 96.5% occupied across 10,124 units, per Cushman & Wakefield, with average effective rent of $2,046, up 5.2%. Only 27 new units were delivered there in the first half of 2026, with 120 more under construction.
Just south, the Wicker Park/Ukrainian Village/West Town submarket was 95.3% occupied. It’s one of the few neighborhood areas that added meaningful supply this year (177 units, a 3.4% bump to inventory), and its occupancy was down 1.2 points from a year earlier. Further out, Northwest Chicago sat at 95.7%, with average effective rent of $1,360.
Downtown apartment vacancy: tight in the Loop, looser in West Loop
Downtown as a whole was 94.9% occupied, according to Cushman & Wakefield, but the range inside it is wide. The Loop was 96.6% occupied, and the South Loop rose 1.5 points from a year earlier to 95.5%, one of the biggest gains in the metro.
West Loop/Fulton Market was the loosest downtown submarket at 93.9%. It’s also where the building is: 1,082 units under construction and 10,177 proposed, far more than any other part of the city. New buildings take months to lease up, so more supply usually shows up first as more vacancy. Cross Street found Fulton Market also led downtown in rent growth, at 9%.
Where Chicago apartment vacancy runs highest
Even the loosest parts of the city aren’t loose. Cushman & Wakefield’s lowest-occupancy city submarkets were Southwest Chicago at 93.7% (average effective rent $1,152) and the South Lakefront at 94.0% ($1,439), alongside West Loop/Fulton Market at 93.9%. Cross Street found occupancy above 93% in every neighborhood it tracked.
For context, Cushman & Wakefield’s 10-year average occupancy for the metro is 93.8%. So the “high vacancy” end of Chicago today is roughly where the whole market has averaged over the past decade.
What neighborhood vacancy numbers leave out
These numbers cover managed apartment buildings; Cushman & Wakefield notes its figures include buildings of five or more units. That misses a big share of Chicago’s rentals: the two-flats, three-flats and greystones that line side streets in Logan Square, Avondale, Lakeview and much of the rest of the city. Those units turn over on their own schedule, often listed by an owner who lives downstairs, and never show up in a quarterly report.
So treat the submarket figures as a weather report, not a map. A 96.7% occupancy rate means competition for the units in big buildings; it doesn’t mean the block you want has nothing. Walking the street on a Saturday still finds things a database won’t.
Scored an apartment on a block where nothing ever opens up? Tell us how with #Chicago111.
Sources: Cushman & Wakefield, Chicago Multifamily Q2 2026; Northmarq, Chicago Multifamily Market Insights Q2 2026; REjournals on Cross Street’s Q2 2026 Chicago report (Aug. 26, 2026).
Photo: Alicja Podstolska / Unsplash
Like a place in this story? Go see them in person. One less Amazon order a week.
Leave a Reply